Visualise the word frequency with wordcloud plot
 Wordclouds
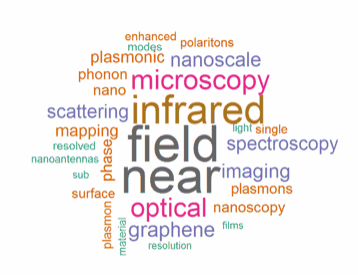
Here is the example of using worldcloud package to visualise the frequency of the words in a piece of text file. In the example we compare the titles of the articles published in scientific journals presented by two companies. First we load data by readLines function, then convert it to corpus format by the command Corpus(VectorSource(textA). Next part includes data cleaning: removing numbers, removing typical English stopwords and removing dataset specific words. Then the frequency of the entries are calculated with TermDocumentMatrix function. wordcloud function is used to visualise the results.
library("tm")
library("SnowballC")
library("wordcloud")
library("RColorBrewer")

# Read the text files
filePath1 <- "a_titles.txt"
filePath2 <- "n_titles.txt"
textA <- readLines(filePath1)
textN <- readLines(filePath2)

# Load the data as a corpus
docsA <- Corpus(VectorSource(textA))
docsN <- Corpus(VectorSource(textN))

# Convert the text to lower case
docsA <- tm_map(docsA, content_transformer(tolower))
docsN <- tm_map(docsN, content_transformer(tolower))

# Remove numbers
docsA <- tm_map(docsA, removeNumbers)
docsN <- tm_map(docsN, removeNumbers)

# Remove english common stopwords
docsN <- tm_map(docsN, removeWords, stopwords("english"))
docsA <- tm_map(docsA, removeWords, stopwords("english"))

# specify and remove your stopwords as a character vector
docsA <- tm_map(docsA, removeWords, c("using", "analysis", "characterization", "type"))
docsN <- tm_map(docsN, removeWords, c("using", "analysis", "characterization", "type"))
dtm1 <- TermDocumentMatrix(docsA)
m1 <- as.matrix(dtm1)
v1 <- sort(rowSums(m1),decreasing=TRUE)
d1 <- data.frame(word = names(v1),freq=v1)

dtm2 <- TermDocumentMatrix(docsN)
m2 <- as.matrix(dtm2)
v2 <- sort(rowSums(m2),decreasing=TRUE)
d2 <- data.frame(word = names(v2),freq=v2)

#  ploting
wordcloud(words = d1$word, freq = d1$freq, min.freq = 1,
          max.words=30, random.order=FALSE, rot.per=0.1,
          colors=brewer.pal(8, "Dark2"))

wordcloud(words = d2$word, freq = d2$freq, min.freq = 1,
          max.words=30, random.order=FALSE, rot.per=0.1,
          colors=brewer.pal(8, "Dark2"))

Krzysztof Banas
Principal Research Fellow
I work as beam-line scientist at Singapore Synchrotron Light Source. My research interests include application of advanced statistical methods for hyperspectral data processing (dimension reduction, clustering and identification).