Map of the Integral (Interpolated) with Annotations
 Interpolated Map with Annotations
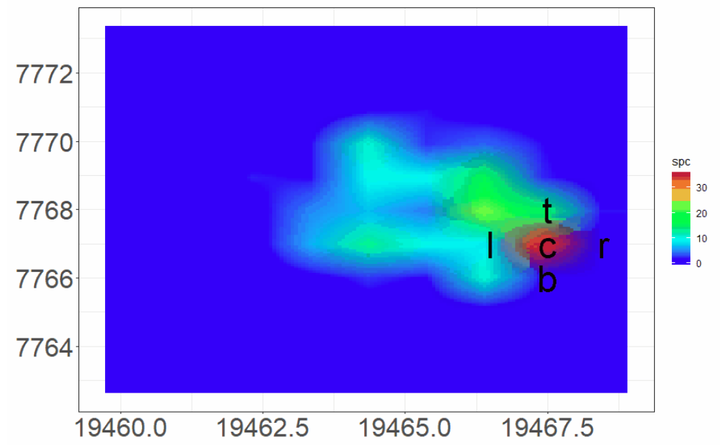
Integral map prepared from mIRage exported csv. First the dataset is imported by read.csv. In the early version of PTIR Studio there was a bug causing map beign flipped in Y direction. Depending on the software version please use function with or without sort. Band of interest is set as peak1 variable. Default integration range is 40 cm-1 but it may be adjusted. Display interpolation is done with geom_raster and interpolate parameter set as TRUE. Additional layer of labels is done with annotate("text") command. Positions x and y, as well as label text is set manually in this example.
library(hyperSpec)
library(here)
f="RDX_mirrIR_finger_hyper4.csv"
path01<-here::here("DATA",f)
dataset01 <- read.csv(path01)
wavenumbers  <- read.csv(path01, header = FALSE, nrow = 1)
wavenumber<-as.vector(t(wavenumbers[3:length(wavenumbers)]))
spectra<-as.matrix(dataset01[,-c(1:2)])
d1<-as.data.frame(dataset01[,1])
#there is a bug in the export to csv in PTIR Studio 4.1
#causing map being flipped in Y direction
#line below there is a fix for this
#if this is corrected sort should be replaced by non sorted
d2<-as.data.frame(sort(dataset01[,2]))
#d2<-as.data.frame(dataset01[,2])
addata<-cbind(d1,d2)
colnames(addata)<-c("x","y")
addata1<-round(addata,digits=2)
hypspec1<-new("hyperSpec", wavelength = wavenumber,
              spc = spectra, data=addata1)

theme_new <- theme_set(theme_bw())
theme_new <- theme_update(axis.text = element_text(size = 14),
                          axis.title = element_text(size = 20,face = "bold"))
peak01<-1269
inten01<-apply(hypspec1[,,peak01-20~peak01+20], 1, mean)
long1<-as.long.df(inten01)
plot1<-ggplot(long1,aes(x, y)) +
  geom_raster(aes(fill=spc),interpolate = TRUE)+
  scale_fill_gradientn (colours = matlab.palette ())
plot1 +
  theme(axis.title       = element_blank(),
        panel.background = element_blank(),
        axis.text = element_text(size = 24))+
annotate("text", x = c(19466.5, 19467.5,19468.5, 19467.5, 19467.5),
         y = c(7767,7767,7767,7768,7766),
         label = c("l", "c", "r", "t", "b"), colour = "black", size=12)
Krzysztof Banas
Principal Research Fellow
I work as beam-line scientist at Singapore Synchrotron Light Source. My research interests include application of advanced statistical methods for hyperspectral data processing (dimension reduction, clustering and identification).