Histogram from the map
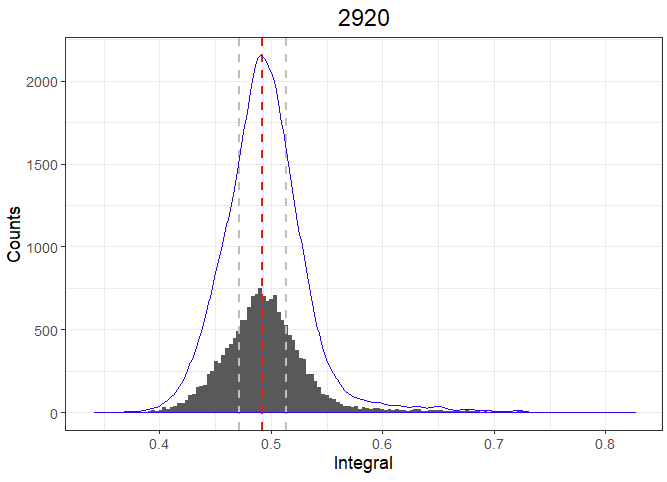
This code chunk shows how to plot histogram in ggplot2 and calculate some parameters related with it. First the position of the maximum of density function by command density(ratio2920$ratio)$x[which.max(density(ratio2920$ratio)$y)] then the median value for the histogram median(ratio2920$ratio) and the values of Inter Quartil Range with IQR function.
peak01<-2920
inten01n<-apply(spc1sa_bc_norm[,,peak01-5~peak01+5], 1, max)
ratio2920<-as.data.frame(inten01n$spc)
 colnames(ratio2920)<-"ratio"

 denmax6<-density(ratio2920$ratio)$x[which.max(density(ratio2920$ratio)$y)]
 medianhist6=median(ratio2920$ratio)
 IQR6=IQR(ratio2920$ratio)
 low6<-medianhist6-IQR6/2 low6
 high6<-medianhist6+IQR6/2 high6

hist6a<-ggplot(ratio2920, aes(x=ratio)) + geom_histogram(binwidth = function(x) 2 * IQR(x) / (length(x)^(1/3))) +
   geom_vline(xintercept=median(ratio2920$ratio), lwd=1, linetype=2, color="red")+
   geom_vline(xintercept=medianhist6-IQR6/2, lwd=1, linetype=2, color="grey")+
   geom_vline(xintercept=medianhist6+IQR6/2, lwd=1, linetype=2, color="grey")+
   geom_density(aes(y=0.01 * ..count..), col=4) +ggtitle("2920")+
   labs(x="Integral", y = "Counts")
 hist6a
Krzysztof Banas
Principal Research Fellow
I work as beam-line scientist at Singapore Synchrotron Light Source. My research interests include application of advanced statistical methods for hyperspectral data processing (dimension reduction, clustering and identification).