Animate spectra from csv file
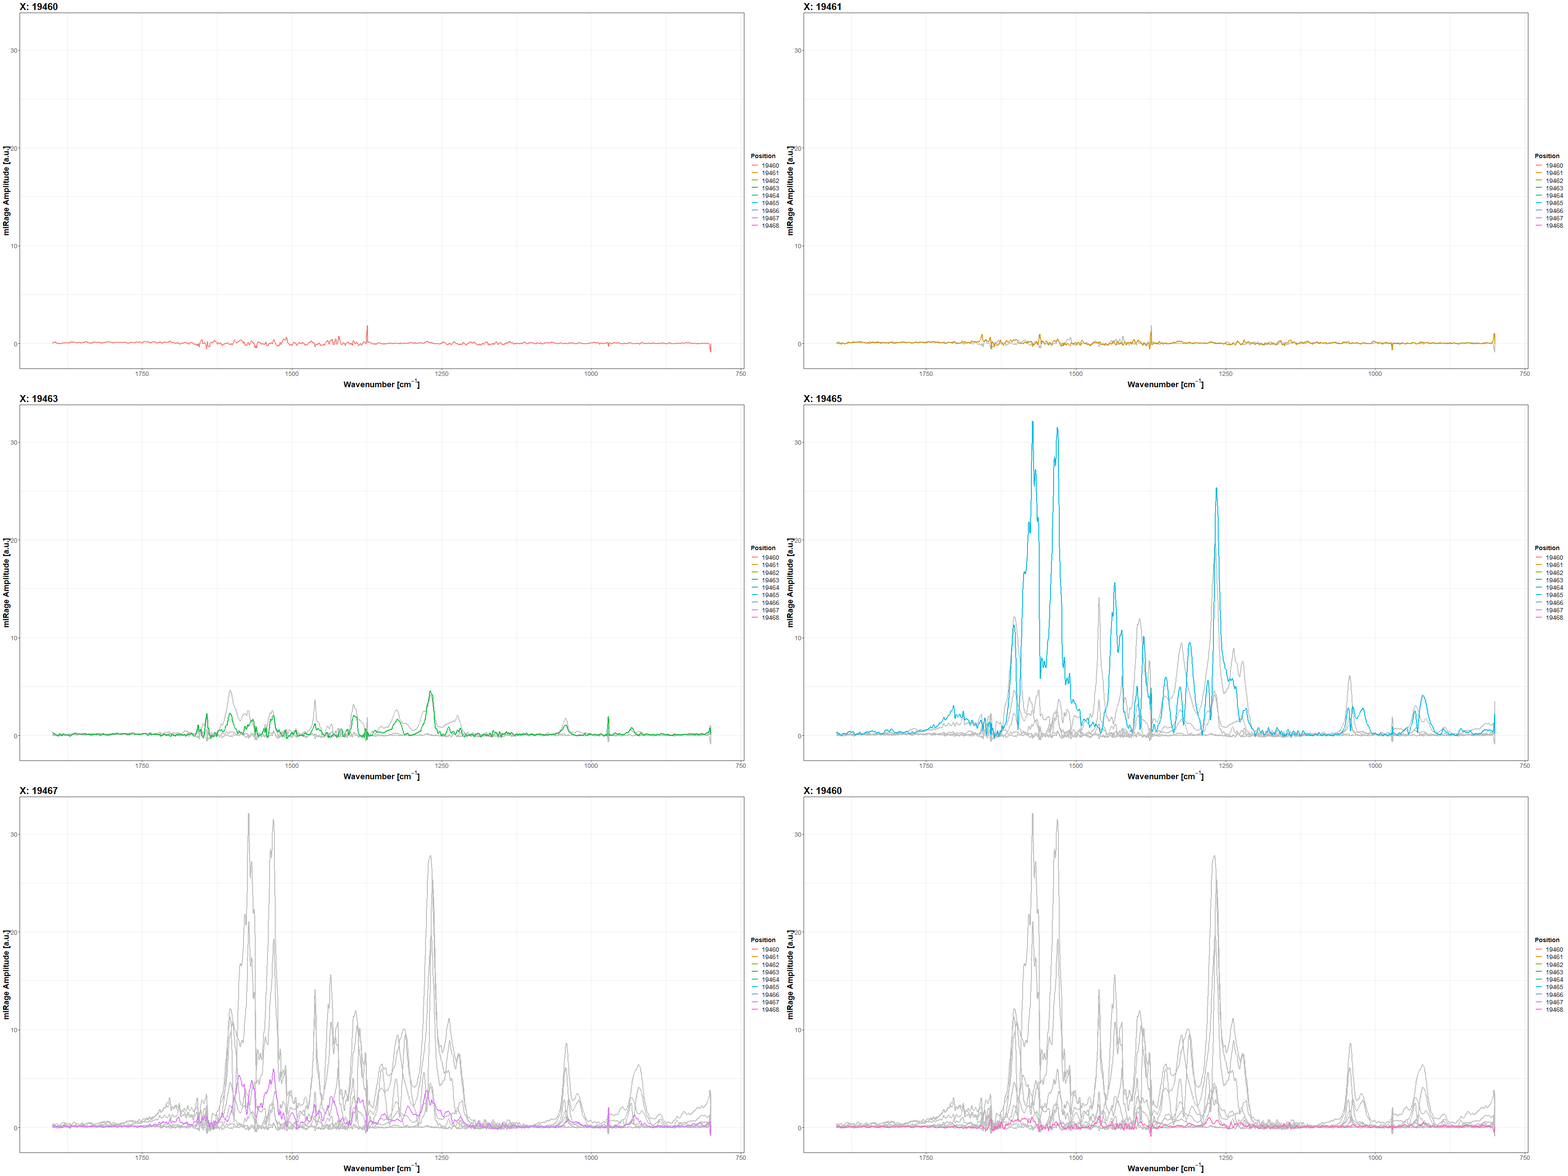
First we import spectra from csv matrix to hyperspec object using read.csv and new functions. Then hyperspec is subset to one row of data only by command hyper01[hyper01$Y==line1] and converted to long data by as.long.df function. Then ggplot2 plot is defined with transition_states(X) set to vary over X positions of spectra (subsequent points). Additionally setting shadow_mark(size = 1, colour = 'grey') will leave on later frames of animations traces of previous specta. animate function will do the job of animation and anim_save will export animation to gif format. You can pass an alternate renderer to the animate function in order you can control the animation format. To create video files in gganimate you can e.g. use the ffmpeg_renderer
library(hyperSpec)
library(dplyr)
library(gganimate)

#Import
mIRage01 <-
  read.csv("RDX_mirrIR_finger_hyper4_ICAVS_2019.csv", header=FALSE)
spectra<-as.matrix(mIRage01[2:nrow(mIRage01),3:ncol(mIRage01)])
wavenumbers<-as.numeric(mIRage01[1,3:ncol(mIRage01)])
exdata<-mIRage01[2:nrow(mIRage01),1:2]
colnames(exdata)<-c("X","Y")

#Create hyperspec
hyper01<-new ("hyperSpec", wavelength = wavenumbers, spc = spectra, data= exdata)

#Subset one line
line1=7767.020508
line01 <- hyper01[hyper01$Y==line1]

#Change to long data
long01<-as.long.df(line01)
#Rounding

long02 <-long01 %>% mutate_at(3:4, round, 0)
#animate

#ggplot theme adjustment
theme_new <- theme_set(theme_bw())
theme_new <- theme_update(axis.text = element_text(size = 14),
                          axis.title = element_text(size = 18,face = "bold"),
                          title =element_text(size=18, face='bold'),
                          legend.title=element_text(size=14),
                          legend.text=element_text(size=14)
                          )
p1<-ggplot(long02, aes(x = .wavelength, y = spc, color = as.factor(X))) +
  geom_line(size = 1) + scale_x_reverse()+
   labs(title= "X: {closest_state}",
       x=expression(bold(paste ("Wavenumber", " [",cm ^-1, "]"))),
       y = "mIRage Amplitude [a.u.]",
       color="Position")+
  transition_states(X) +
  shadow_mark(size = 1, colour = 'grey')
animate(p1, height = 900, width =1800)
#save in gif format
anim_save("test3.gif")
