Ploting FTIR spectrum with ggplot2 - clean theme
Today one trick to get clean theme with ggplot2 graphics for plotting spectra. We start with theme_set (theme_bw()) and modify it according to the requirements. Here only the font for axes labels and axes titles were increased.
#setting theme
theme_new <- theme_set (theme_bw())
theme_new <- theme_update (axis.text = element_text(size = 14),axis.title = element_text(size = 20,face = "bold"))
#faceting on Resolution variable
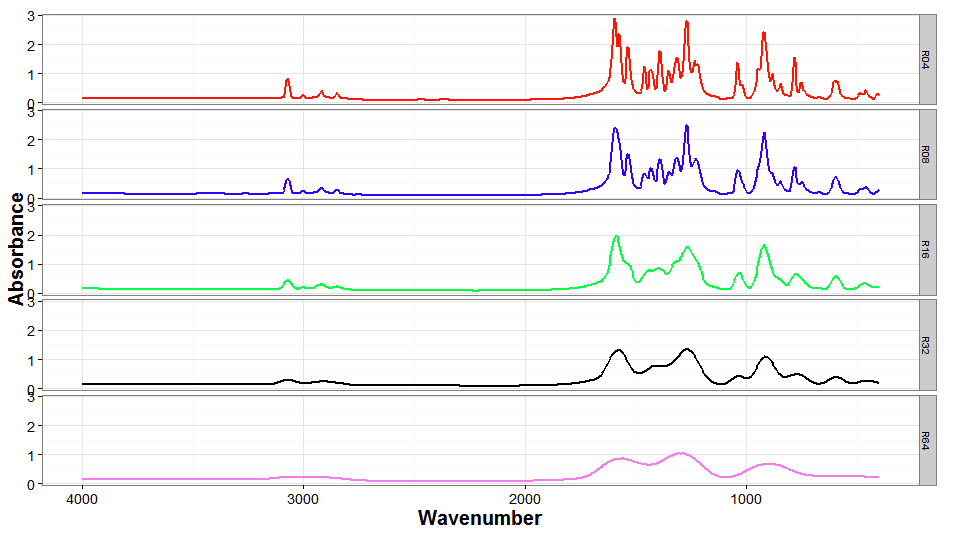
ggplot (meansRDX02, aes (x = Wavenumber, y = Absorbance, colour = Resolution)) + geom_line (size =1) + facet_grid(Resolution ~ . )+ scale_x_reverse()+ guides(colour =FALSE)
#manual colour scheme
ggplot (meansRDX02, aes (x = Wavenumber, y = Absorbance, colour = Resolution)) + geom_line (size =1) + facet_grid(Resolution ~ . )+ scale_x_reverse()+ guides(colour =FALSE) + scale_colour_manual (values = c("red" ,"blue" , "green" , "black" , "violet" ))
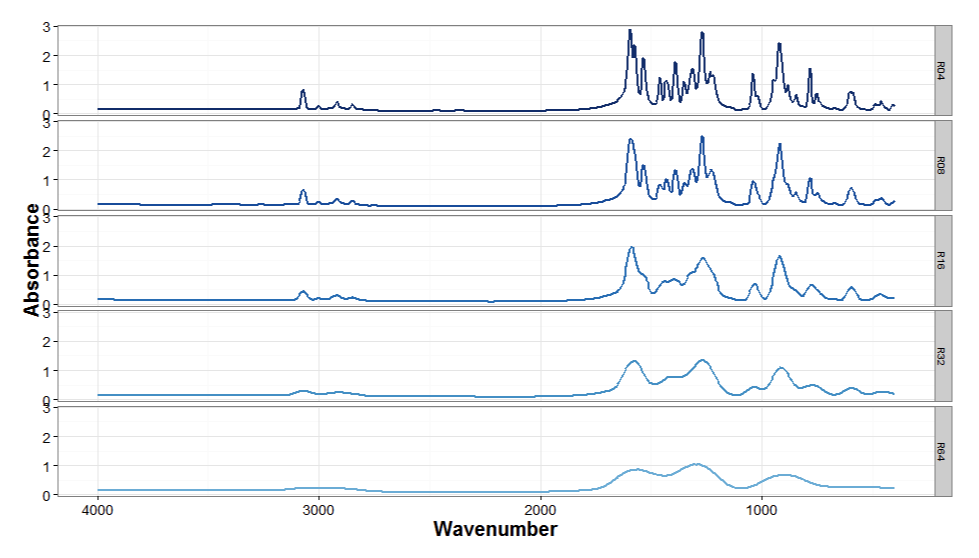
It is possible to manually set the colour scheme for the variable. Here variable Resolution values are mapped to various colours when defining cols5 vector. Then, with plot declaration, scale_colour_manual (values = cols5) is added.
#manual colour scheme defined by external variable
cols5 <- c("R04" = "#08306b", "R08" = "#08519c" ,"R16" = "#2171b5", "R32" = "#4292c6" , "R64" = "#6baed6")
ggplot (meansRDX02, aes (x = Wavenumber, y = Absorbance, colour = Resolution)) + geom_line (size =1) +  facet_grid(Resolution ~ . )+ scale_x_reverse()+ guides(colour =FALSE) + scale_colour_manual (values = cols5)
Krzysztof Banas
Principal Research Fellow
I work as beam-line scientist at Singapore Synchrotron Light Source. My research interests include application of advanced statistical methods for hyperspectral data processing (dimension reduction, clustering and identification).