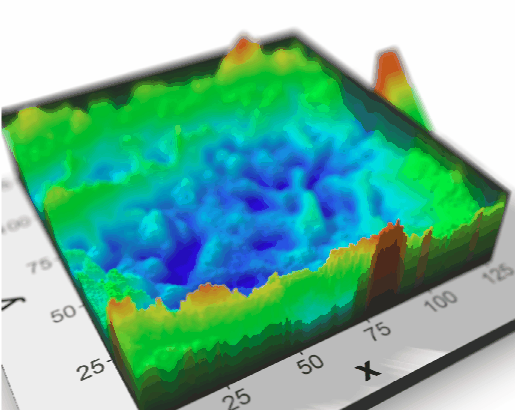
3D rendering of ggplot2
This time some special effects in R. Perhaps it is not useful for scientific paper but may be perfect for the eye-catching graphics. Converting 2D plot (map in this case) is done with plot_gg and render_depth functions from rayshader package. Additionally it is possible to create a short animation with render_movie function from the same package.
#testing 3D
library(rayshader)
intensity_full_map2
plot_gg(intensity_full_map2, multicore = TRUE, width = 8, height = 8, scale = 300,
        zoom = 0.6, phi = 60, background = "#afceff",shadowcolor = "#3a4f70")
#or
par(mfrow = c(1, 1))
plot_gg(intensity_full_map2, width = 5, height = 4, scale = 300, multicore = TRUE, windowsize = c(1200, 960),
        fov = 70, zoom = 0.4, theta = 330, phi = 40)
render_depth(focus = 0.68, focallength = 200)
#movie
render_movie("intensity_full_map2.mp4", frames = 480)
Krzysztof Banas
Principal Research Fellow
I work as beam-line scientist at Singapore Synchrotron Light Source. My research interests include application of advanced statistical methods for hyperspectral data processing (dimension reduction, clustering and identification).