Define your own colours in R part 1
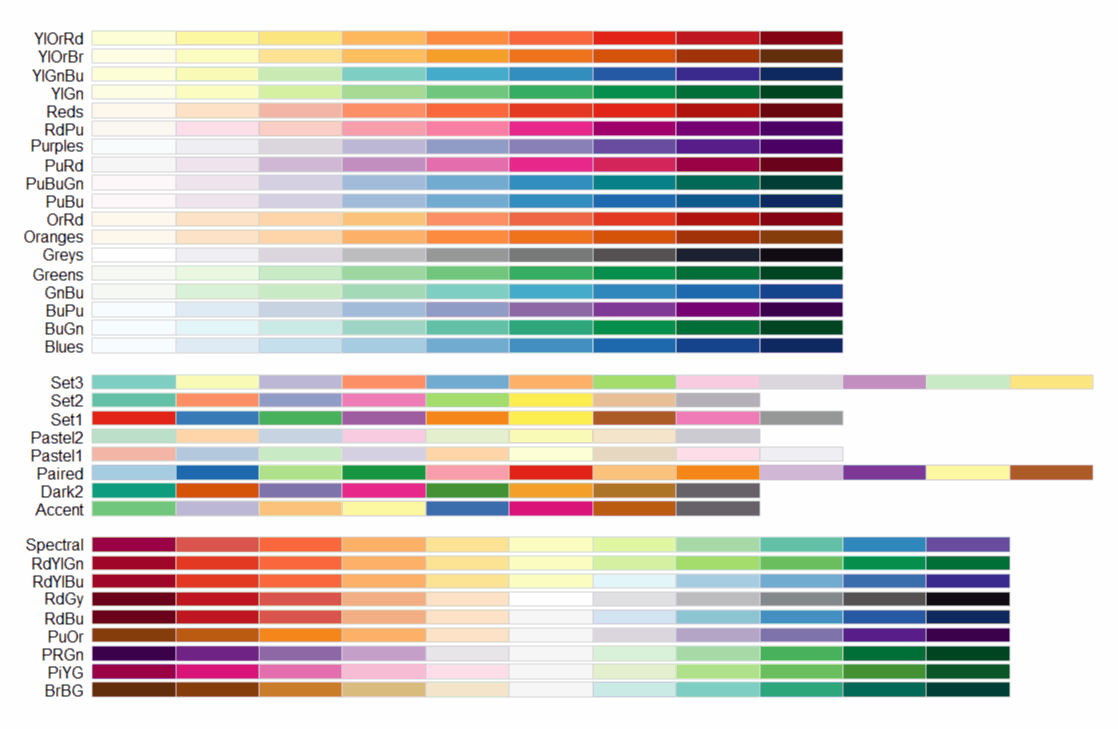
One of the packages dealing with colours in R is RColorBrewer. With function display.brewer.all you can check the names of all palettes available in this packages.
library("RColorBrewer")
display.brewer.all()
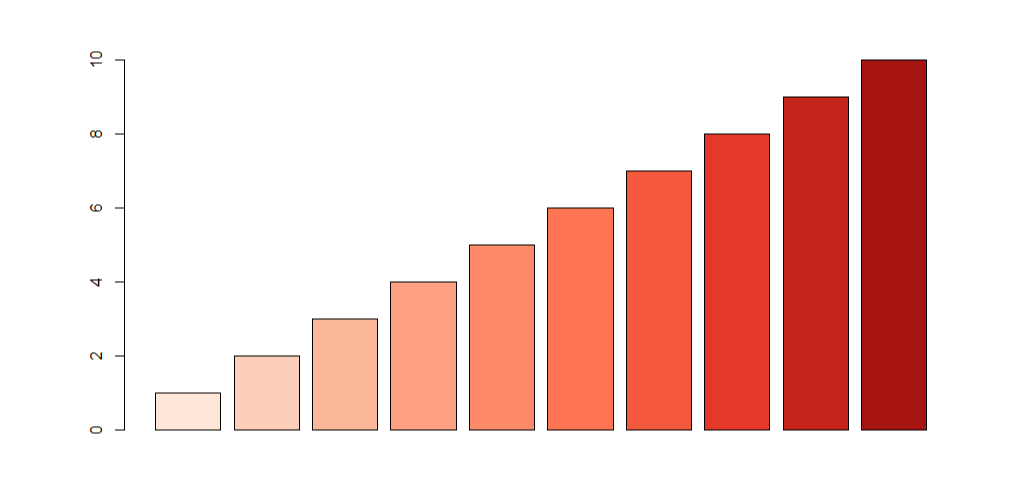
Function colorRampPalette is used to map desired number of colours or shades from a given palette.
#palette with 10 shades of Reds
colors06 <- colorRampPalette(brewer.pal(6, "Reds"))
barplot(c(1:4), col=colors06(10))
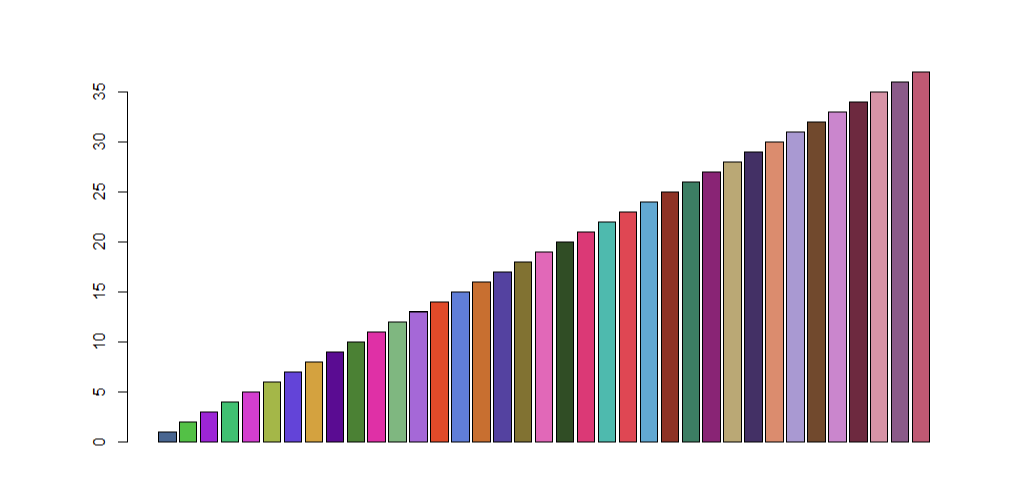
Another way to use colours is to define your own palette (character vector with names or, like in this case hex numbers - do not forget # symbol). Colours defined in this way can be displayed as bar plot with barplot function.
#palette with 37 colours
colors37 = c("#466791","#60bf37","#953ada","#4fbe6c","#ce49d3","#a7b43d","#5a51dc","#d49f36","#552095","#507f2d","#db37aa","#84b67c","#a06fda","#df462a","#5b83db","#c76c2d","#4f49a3","#82702d","#dd6bbb","#334c22","#d83979",
"#55baad","#dc4555","#62aad3","#8c3025","#417d61","#862977","#bba672","#403367","#da8a6d","#a79cd4","#71482c","#c689d0","#6b2940","#d593a7","#895c8b","#bd5975")
barplot(c(1:37), col=colors37)
Krzysztof Banas
Principal Research Fellow
I work as beam-line scientist at Singapore Synchrotron Light Source. My research interests include application of advanced statistical methods for hyperspectral data processing (dimension reduction, clustering and identification).