PCA Scores ploted with ggplot2
 First Principal Component Map
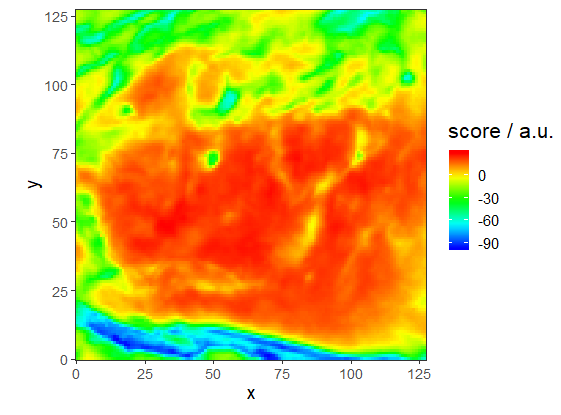
Calculating principal components of spectra matrix with function prcomp. Function decomposition is used to re-import results of the analysis to hyperspec object. Then first three principal components are visualised as false colour maps (matlab.palette) with qplotmap function.
pca <- prcomp(spc1sa[[]], scale. = TRUE, rank. = 10)
scores <- decomposition (spc1sa, pca$x, label.wavelength = "PC", label.spc = "score / a.u.")
#PC1
qplotmap (scores[,,1]) + scale_fill_gradientn (colours = matlab.palette ())
#PC2
qplotmap (scores[,,2]) + scale_fill_gradientn (colours = matlab.palette ())
#PC3
qplotmap (scores[,,3]) + scale_fill_gradientn (colours = matlab.palette ())
Krzysztof Banas
Principal Research Fellow
I work as beam-line scientist at Singapore Synchrotron Light Source. My research interests include application of advanced statistical methods for hyperspectral data processing (dimension reduction, clustering and identification).