Function to find spectral peak shift
Script below shows how to calculate band shift for hyperspectral object (map). First find.max function is defined, then we set the spectral range for the search of maximum. The output of the function find.max is the position of the maximum (wavenumber) not its amplitude.
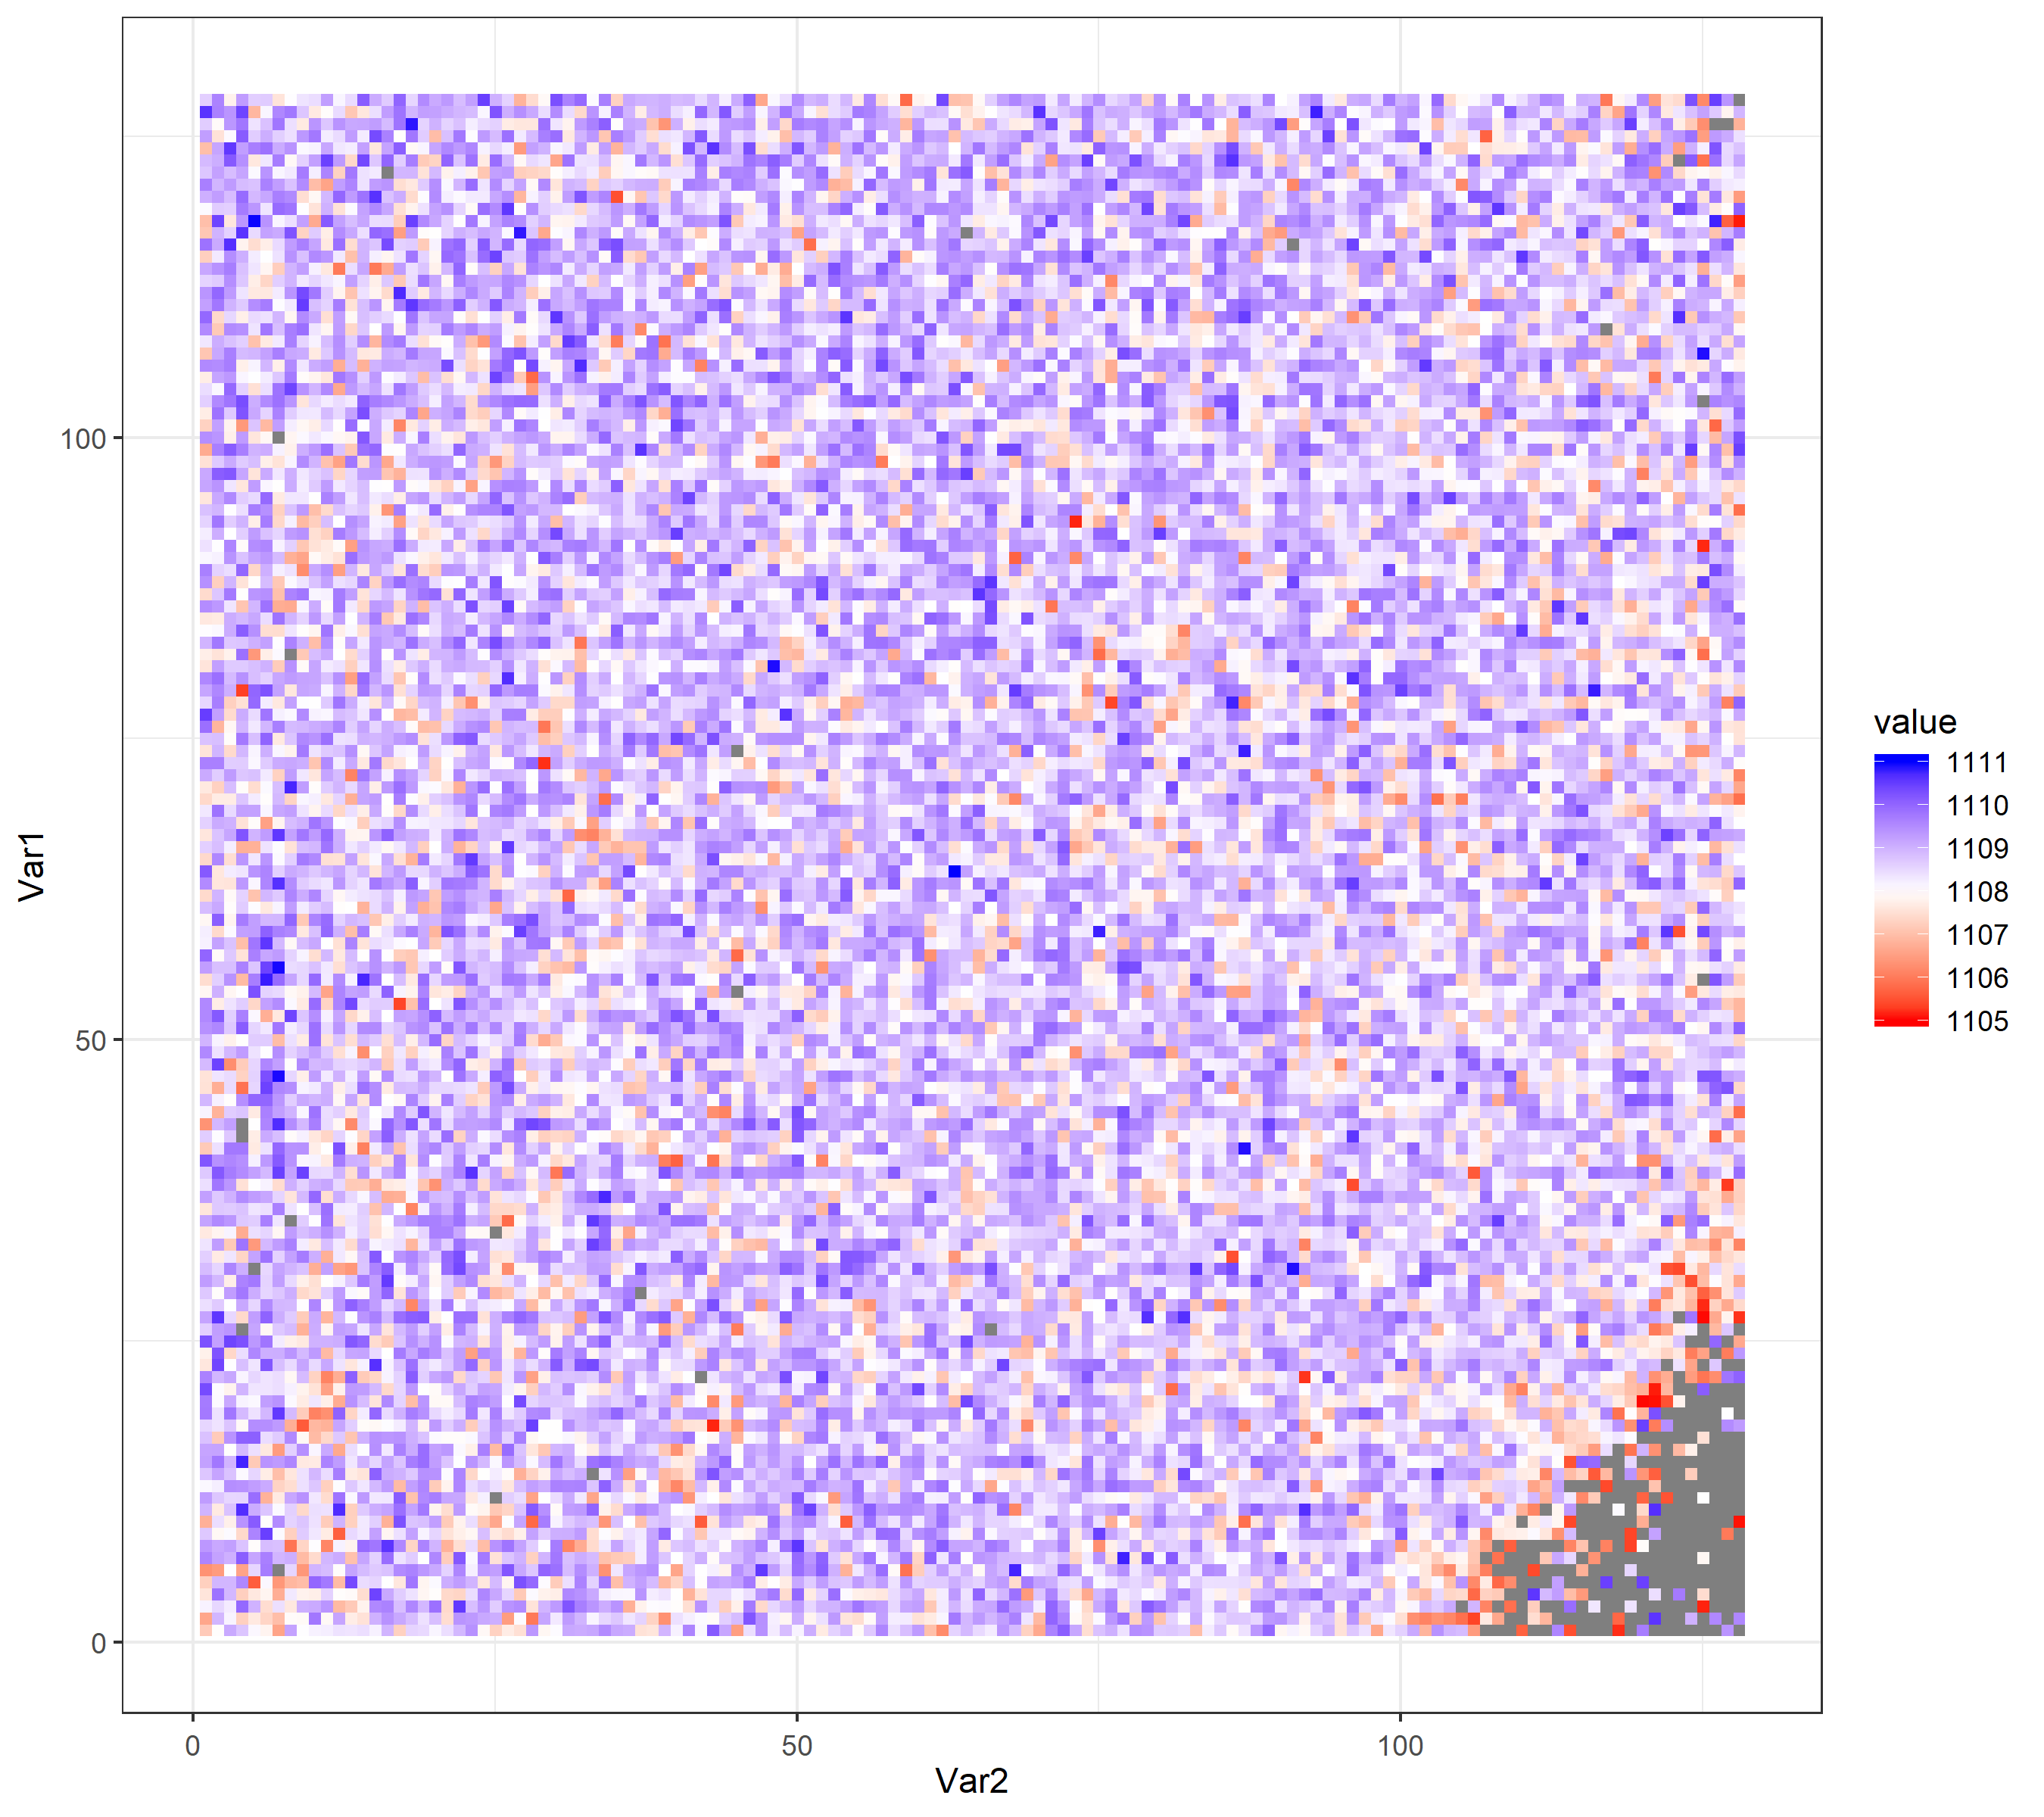
Subsequently we use standard R fuction apply to use find.max function on whole hyperspectral object (spc1). Final steps are for the visualization purpose: converting bandpos into matrix, melting data to long data format (longmat) and ploting this data frame with ggplot2 system.
In order to have the colour scale with white for mean value of the bandpos matrix as well as red and blue shifts we calculated mean value of
longmat$value and define following scale gradient:
scale_fill_gradient2(midpoint=mid1, low="red", mid="white", high="blue", space ="Lab")
# define the function
find.max <- function (y, x){
  pos <- which.max (y) + (-1:1)
  X <- x [pos] - x [pos [2]]
  Y <- y [pos] - y [pos [2]]
  X <- cbind (1, X, X^2)
  coef <- qr.solve (X, Y)
  - coef [2] / coef [3] / 2 + x [pos [2]]
}
# set the range
x1<-1000
x2<-1200
# calculate shift
bandpos <- apply (spc1[[,, x1~x2]], 1, find.max, wl(spc1 [,, x1~x2]))
mat1<-matrix(bandpos, nrow=128,ncol=128)

# melt data to long format
longmat<-melt(mat1)
mid1<-mean(longmat$value)

# plot map of shifts
ggplot(longmat, aes(x = Var2, y = Var1)) +
  geom_raster(aes(fill=value)) +
  scale_fill_gradient2(midpoint=mid1, low="red", mid="white",
                        high="blue", space ="Lab" )+
  theme_bw() + theme(axis.text.x=element_text(size=9, angle=0, vjust=0.3),
                     axis.text.y=element_text(size=9),
                     plot.title=element_text(size=11))

# save plot to file
ggsave("Frequency_Shift_1108.png", width=9, height=8)
Krzysztof Banas
Principal Research Fellow
I work as beam-line scientist at Singapore Synchrotron Light Source. My research interests include application of advanced statistical methods for hyperspectral data processing (dimension reduction, clustering and identification).