Hidden R gems: package janitor
janitor: Data cleaning made easy! janitor helps you clean up messy data in a flash, with functions to remove special characters, whitespace, and more. Say hello to tidy data!
Hidden R gems: package datapasta
datapasta: Copy-pasting data just got easier! datapasta lets you seamlessly paste data from spreadsheets or tables directly into your R scripts as data frames or tibbles. It’s a real time-saver!
Hidden R gems: package packman
pacman: Tired of typing
install.packages() for each new package you need? pacman is here to save the day! It’s a Swiss Army knife for package management, making installing, loading, and updating packages a breeze!Simple Spectrum Plotter
Summary
Unique rows based on more than one variable
Find the number of unique rows based on more than one variable in the data frame.
Order of the Columns
Summary
McNemar’s test
Summary
Fisher’s exact test
Fisher’s exact test
Chi-square test of independence
Chi-square test of independence to check if there’s an association between two categorical variables
Correlation Tests: Kendall’s
Correlation Test to assess a possible association between two numeric variables, X and Y: Kendall’s coefficient
Pivot Table
Pivot Table
Correlation Tests: Spearmans
Correlation Test to assess a possible association between two numeric variables, X and Y: Spearman’s coefficient
Correlation Tests: Pearson's coefficient
Correlation Test to assess a possible association between two numeric variables, X and Y: Pearson’s coefficient
Post-hoc multiple comparisons using Tukey test and Dunn's test
Post-hoc multiple comparisons using Tukey test and Dunn’s test in R
Kruskal-Wallis test
The Kruskal-Wallis test is a rank-based non-parametric alternative to the one-way ANOVA and an extension of the Wilcoxon-Mann-Whitney test to allow the comparison of more than two independent groups.
One-way analysis of variance
One-way analysis of variance is a statistical test used when we want to compare several means.
Wilcoxon Signed-Rank test
Wilcoxon Signed-Rank test (Wilcoxon test): a non-parametric test that can be conducted to compare paired samples when the differences are not normally distributed
A paired t-test
A paired t-test is used to estimate whether the means of two related measurements are significantly different from one another
Wilcoxon-Mann-Whitney (WMW) test
Wilcoxon-Mann-Whitney (WMW) test to compare two independent samples
Two sample t-test (Student’s t-test)
Two sample t-test (Student’s t-test)
Equality of medians with violin plot
Test the equality of two groups medians and plots violin plot using ggstatsplot library with data points jittered
R and Python Comparison
R and Python comparison for simple spectral processing
How to save ggplot2 plot to pdf with high resolution?
Save ggplot2 to pdf
How to change default ggplot2 settings to improve readability of the plot?
Improving readability of the ggplot2
How to remove y-axis labels in ggplot
How to remove y-axis labels in a ggplot chart
Recode the factors with tidyverse
How recode the factors in R to give them modified names and order with tidyverse
Airports Map
Map with airports location from csv
Find columns that include missing values (NA)
find which columns in an R data frame include missing values (NA)
Ploting in the loop
Summary
create a new hyperspectral object with the hyperSpec package in R
Create a new hyperspectral object
Convert wide to long with the function pivot_longer (library tidyr)
Convert wide to long with the function pivot_longer (library tidyr)
Functions and default settings for PCA in R
Functions and default settings for PCA in R
Visualise the word frequency with wordcloud plot
Wordcloud plot to compare two text files.

Fitting exponential decay to beam current data
Exponential decay fitting

Import csv matrix from PTIR Studio
Method for importing to R csv matrix from mIRage device
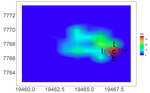
Map of the Integral (Interpolated) with Annotations
Integral Map with Annotations
Histogram from the map
Calculating and ploting the histogram of the pixel values extracted from the map. Works for intensites, integrals, ratioes, shifts, etc.
Animate spectra from csv file
Preparing animated gif showing sequence of spectra from subsequent columns
Export matrix with PC or cluster number to csv
Data matrix export to txt file
Derivatives Calculation with diff function
Calculating derivatives with function diff
Ploting FTIR spectrum with ggplot2 - clean theme
ggplot2 - setting clean theme for spectra plot
First and Second Derivative
Calculation of derivatives with Savitzy-Golay filter function
Removing Spectra outside mean ± n SD
Removing Spectra outside selected range
Join multiple dataframes and calculate ratios
Combining multiple dataframes into one and calculating new variables
Packages to print tables in reports
knitr, pander and xtable
Interpretation of spatial moments
Variance, skewness, kurtosis and others
3D rendering of ggplot2
Converting 2D plots into pseudo-3D and animations